Solar Monitoring & Maintenance in Adelaide
Live performance monitoring and scheduled maintenance to protect the return on your Adelaide commercial solar investment.
 4.9Google rating328 reviews
Why it pays
The case for solar monitoring & maintenance
Fault detection within hours, not months
Most unmonitored commercial systems in Australia carry a silent fault for weeks or months before the owner notices reduced generation. Our monitoring detects inverter, string and panel-level anomalies within hours.
Performance reporting for your finance team
Monthly generation reports show actual output versus expected, grid import offset and the dollar value of generation. This data supports depreciation claims and ROI tracking.
Warranty claim support
When a component fails within warranty, you need documented performance data to support the claim. Our monitoring platform keeps a continuous performance record that we provide to manufacturers on your behalf.
The numbers
What to expect
Service inclusions and response times are indicative. Specific service level agreements are confirmed in each O&M contract. Contact us for pricing.
| Service Tier | Monitoring | Annual Site Visit | Fault Response | Reporting |
|---|---|---|---|---|
| Monitor Only | Continuous, 5-min data, alert generation | Not included | Alert notification to site owner | Quarterly automated report |
| Standard O&M | Continuous, 5-min data, fault diagnosis | 1 per year - full inspection | Site visit within 5 business days | Monthly performance report |
| Premium O&M | Continuous, 5-min data, proactive fault management | 2 per year - spring and autumn | Site visit within 2 business days | Monthly report + quarterly ROI review |
Indicative figures. Your written proposal models your exact site.
Why it matters
Engineered for your site, not off the shelf
The system that pays back fastest is the one built around how you actually use power, not a bundle off a price list.
Off-the-shelf install
- A kW figure straight off a price list
- A standard panel + inverter bundle
- Roof filled regardless of your load
- Export you barely get paid for
- Installed, then forgotten
Our engineered approach
- Sized to your actual power bills
- Panels + inverter matched to your site
- Built to maximise self-consumption
- Battery + design to cut peak-demand charges
- Monitored and serviced by our own team
Thinking about solar monitoring & maintenance?
Get a free quote. We model the system, savings and payback before you commit to anything.
How we work
A clear path from enquiry to switch-on
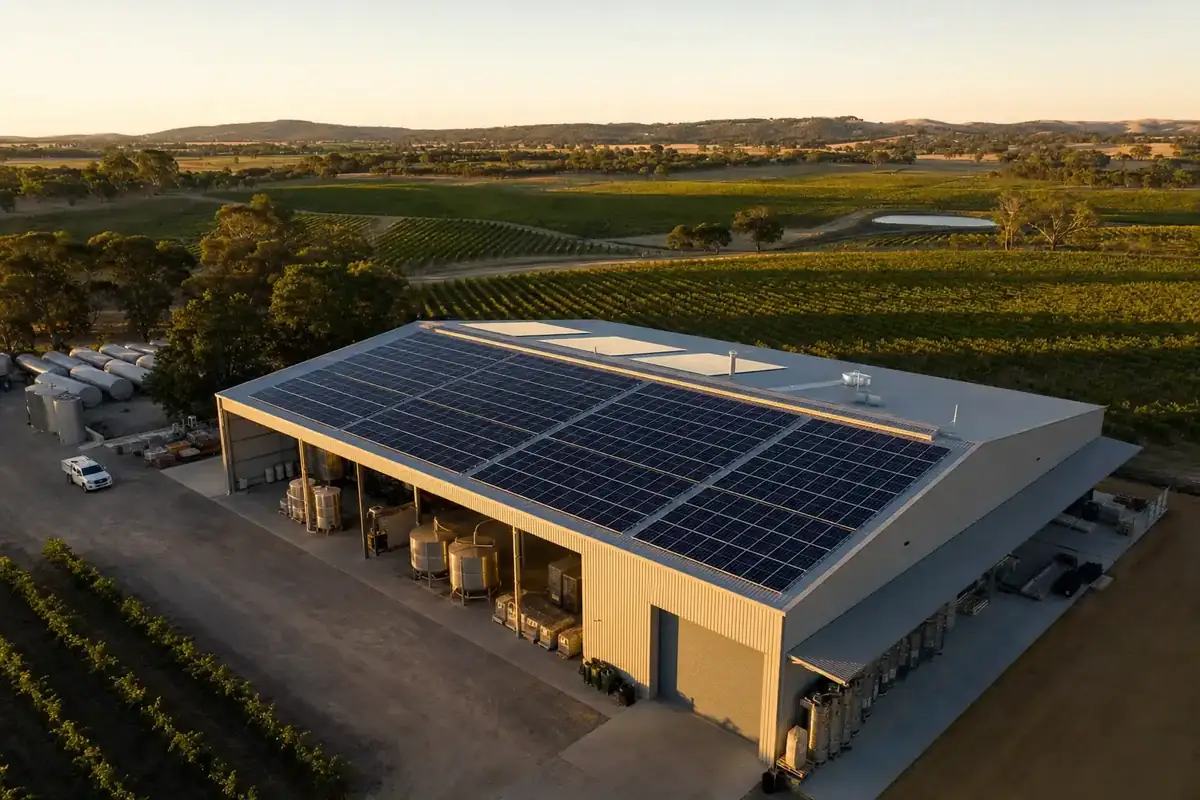
Aerial panel inspection and thermal imaging
We use a thermal imaging camera to identify hotspots on individual panels. A hot cell indicates a bypass diode failure, cell degradation or potential fire risk. Identified panels are flagged for warranty claim or replacement.
DC string testing
Each string is tested for open-circuit voltage and short-circuit current. Strings outside specification indicate a failed panel, loose connection or cable fault. We trace and repair before leaving site.
Inverter inspection and firmware update
We inspect inverter ventilation and cooling, clean filters, check terminal connections and update firmware to the current manufacturer-recommended version.
AC switchboard and generation meter check
We inspect all AC isolators, circuit breakers and the generation meter for correct operation and signs of overheating or corrosion.
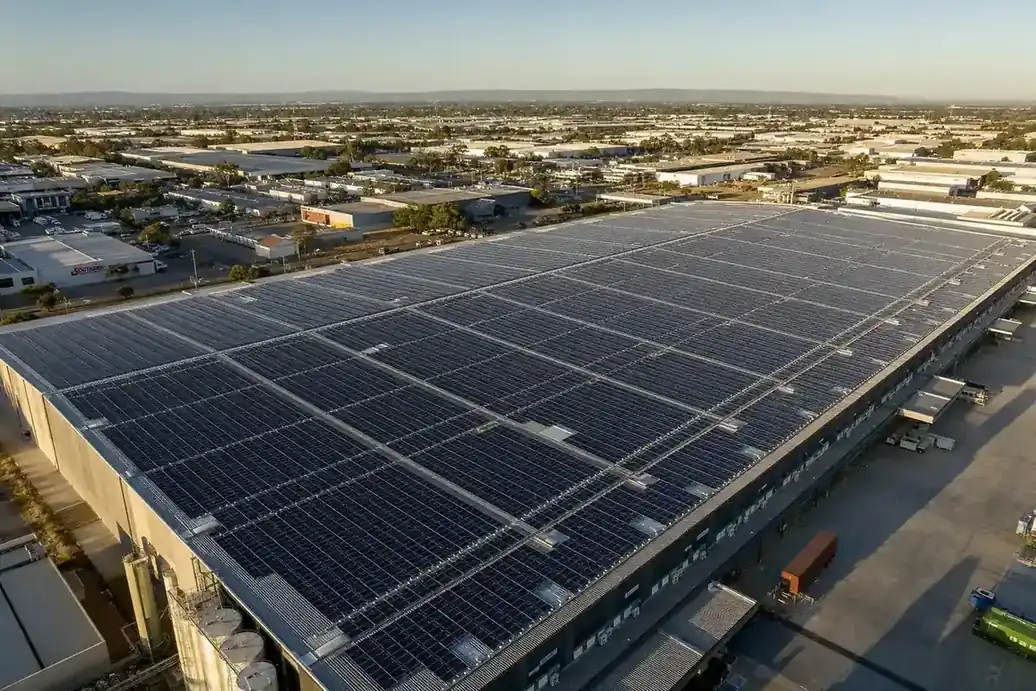
Adelaide & South Australia
A commercial roof is a balance-sheet asset
Put the sun on your roof to work. We design, install and finance systems that pay for themselves and keep saving for decades.
End to end
Everything included, under one roof
In detail
The detail that matters
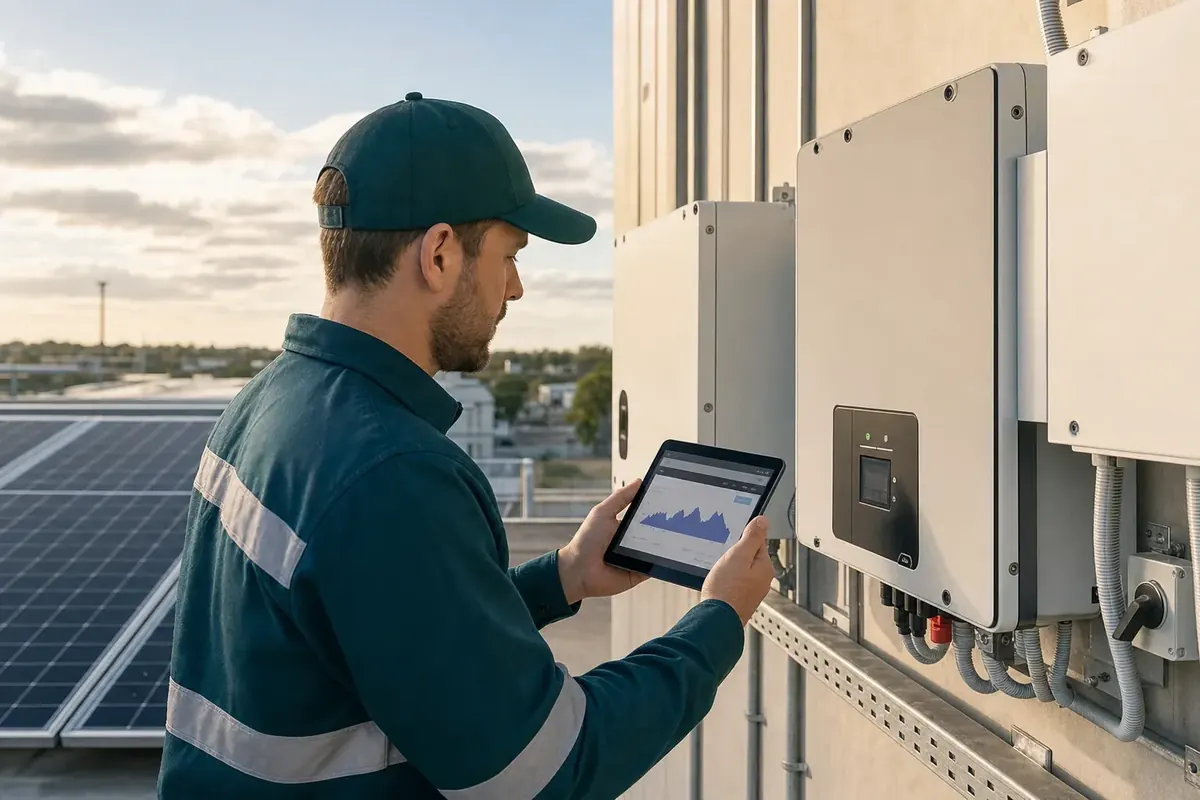
Modern commercial monitoring platforms track generation data at the inverter and, on systems with module-level electronics, at the panel level. The system compares actual generation against a modelled baseline that accounts for current irradiance, temperature and system design.
When actual generation falls more than a configured percentage below the modelled baseline for a sustained period, an alert is triggered. Our technical team reviews the alert, diagnoses the likely cause remotely and schedules a site visit or escalates to the manufacturer if a warranty issue is suspected.
Many installers rely on the inverter manufacturer monitoring portal. These portals do not model expected generation against irradiance, so a gradual 20% degradation caused by soiling or shading looks like normal variation. Independent monitoring with a modelled baseline is the only way to detect gradual performance loss.
We offer three O&M service levels for Adelaide commercial systems. All tiers include continuous remote monitoring. The distinction is in site attendance frequency and response time commitments.
A 100kW system generating $35,000-$50,000 per year in energy savings loses $600-$1,000 per week during a major fault. An annual site visit typically costs a fraction of one week of lost generation. The O&M contract pays for itself the first time it catches a fault that would otherwise have persisted.
We size the system to your load profile, not a sales target. And we monitor it for life to make sure it keeps delivering what we promised.
Commercial Solar Adelaide
Inverter faults
Inverter faults are the most common cause of significant generation loss. A faulted inverter can take an entire section of the array offline. Monitoring detects the fault within one generation cycle. Common inverter issues include communication card failures, blown DC fuses, IGBT faults and cooling system blockages.
DC string faults
A single failed panel in a string reduces the output of the entire string because panels are wired in series. String-level monitoring identifies underperforming strings within hours. On systems without string-level monitoring, a single failed panel can reduce generation by 8-15% and go undetected for months.
- Bypass diode failures causing panel hotspots - common after 5-8 years on early-generation panels
- Loose MC4 connector joints, particularly on systems where connectors were hand-crimped rather than factory-made
- Roof penetration seal deterioration allowing water ingress to junction boxes
- Inverter capacitor degradation causing efficiency loss on older string inverters
- Bird nesting under panel arrays causing shading, soiling and structural loading
- Corrosion on aluminium mounting rails in coastal or industrial environments
Commercial solar systems are often treated as set-and-forget assets once commissioned. In practice, every year without professional attention reduces generation relative to the designed output. The losses accumulate quietly, and their financial impact is typically not noticed until a major fault or a performance comparison triggers an investigation.
| Degradation Cause | Typical Generation Impact | Detection Difficulty Without Monitoring | Average Time to Identify Without Monitoring |
|---|---|---|---|
| Panel soiling - dust, pollen, bird fouling | 5-15% reduction, varies with severity | Low - visible on inspection from ground level | 6-18 months, typically noticed when bills do not reduce as expected |
| String fault - one panel failed in a series string | 8-15% per affected string | High - no visible sign at ground level | 3-12 months without string-level monitoring |
| Inverter efficiency degradation over time | 3-8% over inverter service life | Very high without a modelled baseline | Typically undetected for years on unmonitored systems |
| Shading from tree growth or new structures | 5-25% depending on affected string position | Moderate - seasonal variation masks the impact | 1-3 years to identify without before-and-after generation comparison |
| DC connector resistance from oxidation or loose fit | 2-10% per affected circuit | High - requires physical inspection or thermal imaging | 12-36 months on systems without string-level monitoring |
| Panel hotspot from bypass diode failure | Per-panel output impact plus a fire risk from thermal cycling | Very high - only thermal imaging reveals it reliably | Often undetected until the panel fails completely or a thermal event occurs |
At a self-consumption rate of 75% and a tariff of $0.30 per kWh, a 200kW system generates approximately 280,000 kWh and saves around $63,000 per year. A sustained 10% loss from an undetected fault costs $5,000-$7,000 in foregone savings every year the fault persists. An O&M contract and annual maintenance visit costs a fraction of one year of generation loss from a fault that should have been caught at the first inspection.
- Request a performance report from your current monitoring provider comparing actual versus modelled generation for the past 12 months
- If you have no independent monitoring, request 12 months of generation data from your inverter portal and compare against the original feasibility projection
- Walk the roof perimeter and inspect visible panel surfaces for soiling, cracks or discolouration - a generation reduction above 5% from design warrants a professional inspection
- Check the inverter fault log, which most modern inverters record internally even if no external alert was configured or received
- Confirm your O&M contract includes thermal imaging, as panel hotspots from bypass diode failures are not detectable by visual inspection alone
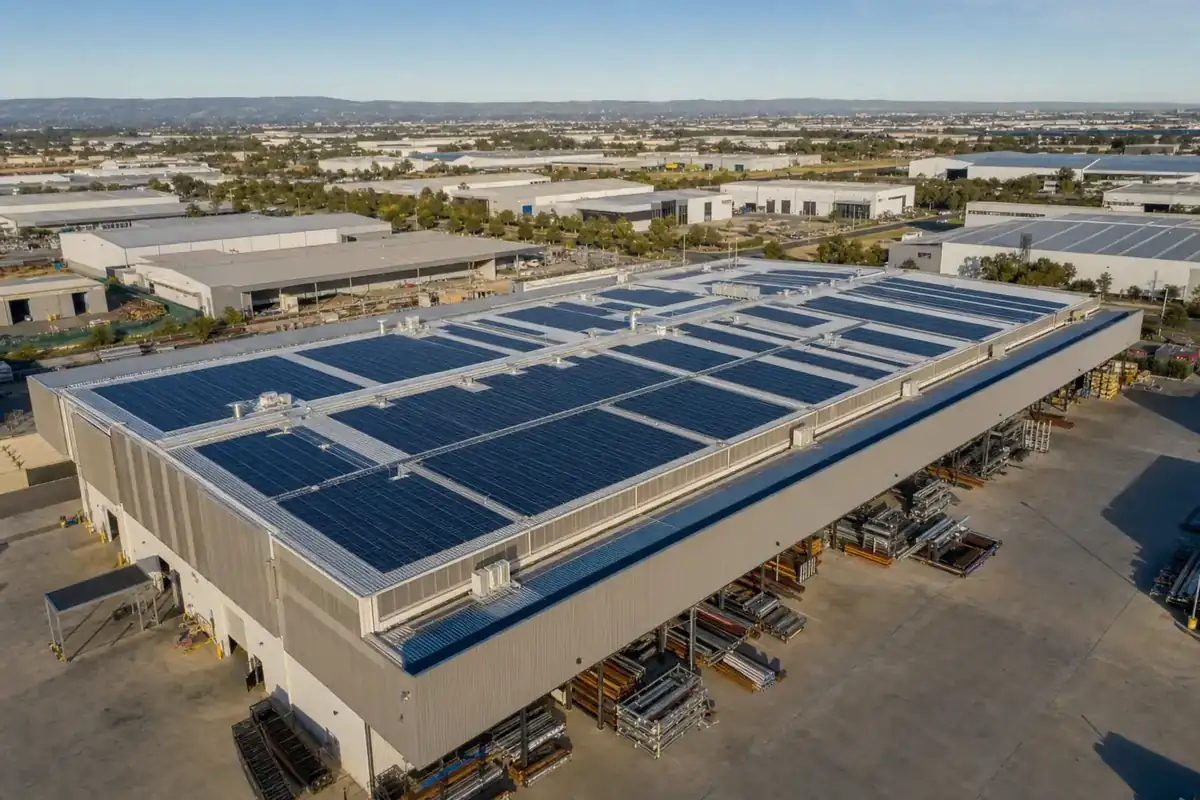

Next step
See what this looks like on your roof
Send us your site details and recent power bills. We'll model the system, savings and payback and put real numbers in front of you, at no cost.
- Free feasibility assessment
- Transparent pricing and payback
- No obligation to proceed
Free quote
Want the numbers for your site?
We model system size, savings and payback before you commit to anything.
(08) 7093 6389FAQ
Frequently asked questions
The reliable way is independent monitoring with a modelled performance baseline. Without this, you are comparing your meter data against a rough expectation with no way to detect gradual degradation. Our monitoring platform compares actual generation against an irradiance-adjusted model and alerts when performance deviates materially. We also produce monthly reports showing actual versus expected generation.
Annual maintenance visit costs depend on system size, location and the scope of work specified. We provide O&M contract pricing after reviewing the system documentation. The cost of a maintenance visit is almost always less than the value of generation lost during a fault that a visit would have prevented.
Yes. We can integrate most major inverter brands into our monitoring platform. If the existing system has an inverter monitoring connection, we can typically onboard it within a few days. If the system has no monitoring hardware, we can assess what retrofitting is required and provide a quote.
Our monitoring system generates an alert to our technical team when generation falls below the modelled threshold for a sustained period. We review the alert data to diagnose the likely cause. Simple faults such as an inverter requiring a reset are often resolvable remotely. Hardware faults requiring a site visit are scheduled based on your O&M service tier response time.
Adelaide panels accumulate dust, pollen and bird fouling. Annual cleaning is typically sufficient for most sites. Properties in high-soiling environments such as grain-handling facilities, construction zones or sites near high bird-activity areas may benefit from cleaning twice per year. We assess soiling during annual maintenance visits and advise on the cleaning frequency that is economically justified.
Our monitoring platform captures generation data at 5-minute intervals, including AC output, DC string currents where instrumented, inverter operating temperature and grid feed-in. Data is retained for the life of the system, providing a continuous performance record for warranty claims, insurance reporting and depreciation documentation.
Start with the numbers, not a sales pitch.
Book a free feasibility assessment and we will model the system, savings and payback for your site before you commit to anything.