

Written by the Commercial Solar Adelaide team
Reviewed by our CEC-accredited commercial solar specialists
For many Adelaide businesses, the peak demand charge on the network tariff is the single most expensive line on the electricity invoice. Solar and battery storage can reduce it systematically. Here is how.
AI Overview
Peak demand charges on South Australian commercial network tariffs are calculated on the highest 30-minute power draw in the billing period, meaning a single equipment startup can set the charge for an entire month. Solar generation reduces daytime demand by offsetting load in real time, while battery storage adds the precision to flatten spikes that solar alone cannot suppress. Businesses that address demand charges actively - rather than simply adding generation capacity - can cut this component of their bill by 30-70% in indicative scenarios while maintaining full operational capability.
Key takeaways
- Demand charges are calculated on your highest 30-minute interval - one spike sets the month
- Solar generation offsets daytime load in real time, reducing demand draw during daylight hours
- Battery adds precision: it discharges during predicted spikes solar cannot fully cover
- Load scheduling - staggering equipment startups - amplifies the effect of both solar and battery
- Indicative demand charge savings of 30-70% are achievable with a well-designed combined strategy
- Energy management software can automate the demand control strategy across your whole site
What Peak Demand Charges Are and Why They Are Expensive
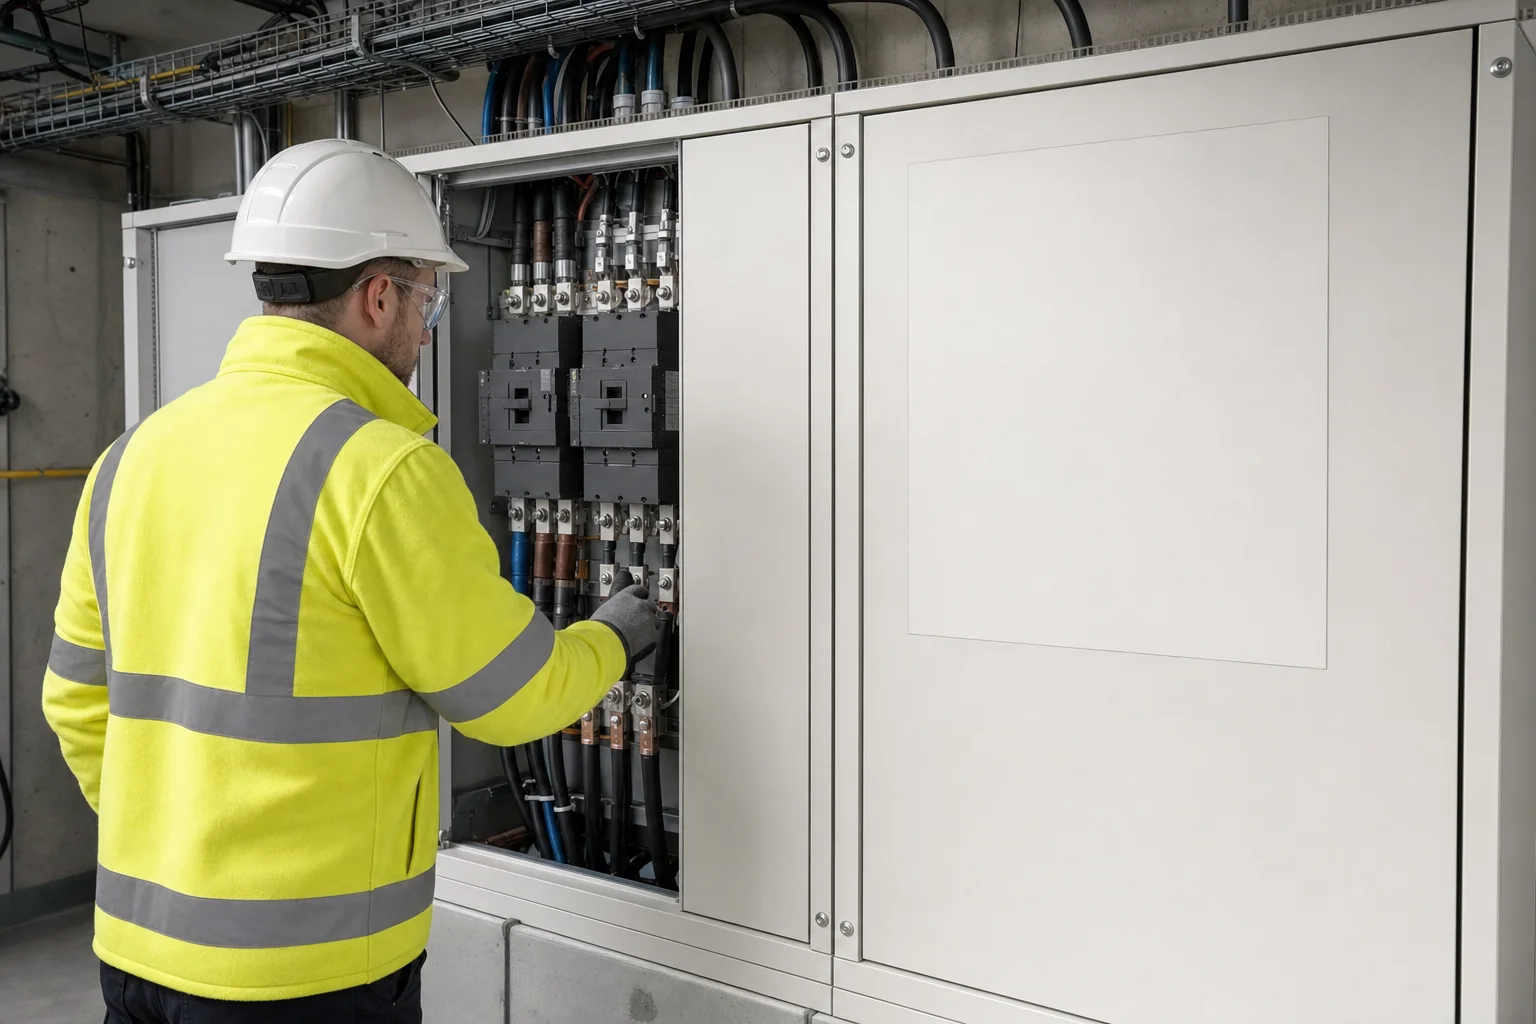
A peak demand charge is a network tariff component that bills you based on the highest power draw your site placed on the grid during a billing period, not on how much energy you consumed in total. It is a capacity reservation fee: the network must be sized to serve your site at its highest possible demand, so you pay for that capacity whether you use it or not.
The measurement window is typically the highest 30-minute average demand recorded in the billing month. For most SA businesses, this measurement is taken in kilowatts or kilovolt-amperes (kVA). The charge is then calculated as this peak measurement multiplied by the applicable $/kW or $/kVA rate.
If your site typically draws 80kW but on one morning three pieces of equipment start simultaneously and pull 140kW for 30 minutes, your demand charge for that entire month is based on 140kW - not 80kW. The remaining 29 days of efficient operation do not reduce that charge. This is why targeted demand management, not just general energy efficiency, is the lever.
How Solar Generation Reduces Your Demand Draw
A solar array connected behind your meter reduces the amount of power your site draws from the grid in real time. If your site demands 120kW at midday but your solar array is generating 80kW, your grid draw is only 40kW. The demand measurement sees 40kW, not 120kW.
This real-time offset is the mechanism by which solar reduces demand charges. It is not about the total energy generated over the month; it is about what the system is generating at the exact moment your demand measurement is taken.
The best commercial demand reduction candidates are businesses whose peak demand occurs during daylight hours, specifically between 9am and 4pm. Manufacturing, warehousing, retail and offices fit this profile well. Businesses whose peak demand occurs in the evening or before dawn - certain hospitality, some food processing - gain less demand charge benefit from solar alone.
| Time of Day | Typical Load | Solar Output | Grid Draw | Demand Contribution |
|---|---|---|---|---|
| 7am | 90kW | 10kW | 80kW | Moderate (demand charge risk) |
| 10am | 110kW | 60kW | 50kW | Reduced (solar helping) |
| 1pm | 120kW | 80kW | 40kW | Low (solar at maximum) |
| 4pm | 115kW | 40kW | 75kW | Moderate (solar declining) |
| 7pm | 100kW | 0kW | 100kW | High (solar gone) |
Want the numbers for your own site?
We model system size, savings and payback before you commit to anything.
How Battery Storage Adds Precision to Demand Control
Solar generation is weather-dependent and cannot be scheduled. On an overcast morning when equipment starts simultaneously, solar may only be generating 20% of its rated output. The demand spike is not suppressed. Battery storage fills this gap.
A battery configured for demand management uses energy management software to monitor your site's demand in real time. When demand approaches a preset threshold, the battery discharges automatically to keep the grid draw below that threshold. The battery does not care whether it is sunny or cloudy - it responds to the demand signal regardless of solar output.
- 01Set a demand threshold in the energy management system
Working with your installer, set a target maximum grid demand - for example, 80kW. The system will attempt to keep your grid draw at or below this level at all times.
- 02Battery charges from solar excess or off-peak grid
During periods when solar generation exceeds load, surplus charges the battery. If this is insufficient, the battery charges from the grid during off-peak rate periods to ensure it has capacity available for demand events.
- 03Battery discharges automatically when demand approaches threshold
When real-time monitoring detects your site approaching the demand threshold, the battery injects power to suppress the spike, keeping the grid draw below the measured demand level.
- 04Monitor and adjust the threshold over time
As you track your demand charge invoices, refine the threshold. Most businesses find the optimal threshold is 10-20% below their historical average demand measurement, which captures the majority of demand charge savings without overly constraining operations.
Load Scheduling: the Free Demand Reduction Strategy
Before spending on hardware, the cheapest demand reduction strategy is scheduling large loads to avoid simultaneous startups. Many demand spikes are caused by HVAC compressors, industrial equipment and EV chargers all starting at the same time.
- Stagger equipment startup sequences by 5-10 minutes so inrush currents do not overlap
- Pre-cool or pre-heat the site using overnight off-peak power before the peak tariff period begins
- Schedule large batch processes (ovens, compressors, CNC machines) to run at times when solar is generating strongly
- Install EV charger management software that limits charging current during peak demand windows
- Review HVAC control settings to implement demand-limiting routines during peak hours
A business that reduces its baseline peak demand through load scheduling, then adds solar to offset daytime load, then adds battery to handle residual spikes, achieves compound demand charge reduction. Each layer amplifies the others. The most cost-effective demand strategies use all three tools in sequence.
Indicative Demand Charge Savings: What Is Achievable?
| Strategy | Typical Demand Reduction | Monthly Saving per 10kW Reduced (Indicative) | Notes |
|---|---|---|---|
| Load scheduling only | 5-15% | $800-$2,000 | No capital cost; requires operational change |
| Solar only | 10-40% | $1,600-$8,000 | Daytime demand only; weather-dependent |
| Battery only (no solar) | 15-30% | $2,400-$6,000 | All-hours capability; weaker economics |
| Solar + load scheduling | 20-50% | $3,200-$10,000 | Best low-cost combination |
| Solar + battery + scheduling | 30-70% | $4,800-$14,000 | Maximum achievable for most sites |
All savings figures are indicative and do not constitute a guarantee of outcome. Your written feasibility study shows the analysis for your specific site.
We size the system to your load profile, not a sales target. For demand charge reduction, that means knowing exactly when your peak occurs before recommending any hardware.
Getting the Right System Design for Demand Reduction
Demand charge reduction requires interval data analysis before system design begins. A designer who recommends a solar or battery size without first analysing your half-hourly load profile is guessing at the outcome.
- 1Request 12 months of half-hourly interval data from your retailer (most commercial customers can request this at no charge)
- 2Identify when your peak demand measurements typically occur and what drives them
- 3Confirm which portion of those peaks occur during solar generation hours
- 4Size the battery discharge rate (kW) to address the portion of peak demand that solar cannot reliably suppress
- 5Set a demand target threshold in the energy management system based on the analysis
- 6Review demand charge invoices quarterly for the first year and adjust the threshold if needed
Explore our commercial solar services
About Commercial Solar Adelaide
We design, install and finance commercial solar and battery systems across Adelaide and regional South Australia, built around your load profile and costed before you commit. Our guides are written and reviewed by our accredited team.
How we put this together
Figures in this guide are indicative and based on typical South Australian commercial tariffs, yields and system pricing at the time of writing. Every project is different, so treat these as a starting point, not a quote. For rebate, tax or finance questions, confirm the current detail with the relevant scheme and your accountant.